Covid Impacts For School Planners
Category:EducationUsing available data from late 2021, the Education Geographics team calculated post-Covid spatial estimates from 2020 to 2031 on total population, pre-schoolers and school-aged children.
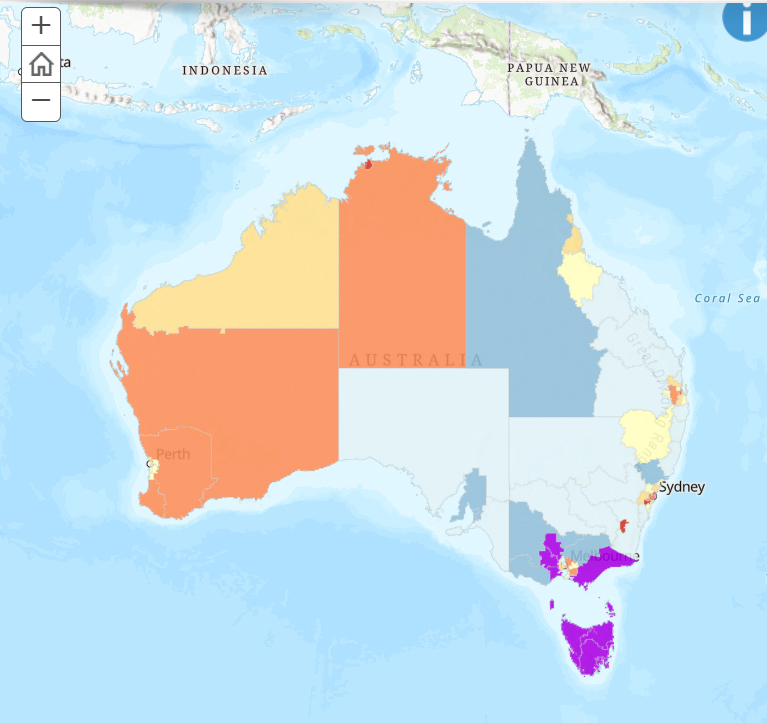
Our preliminary EGS population modelling indicates that the big winners from Covid impacts on total Australian population growth have been the four SA4 ABS statistical regions making up the state of Tasmania, along with four regions within a two-hour commute of the Melbourne CBD: Ballarat, Bendigo, Geelong and La Trobe-Gippsland. (See the purple SA4 regions in our attached map).
Click Map to Zoom
It seems that the big Covid lockdown of Tasmania worked a treat to boost Tasmania’s modest but stable, pre-Covid state annual growth rate, from about 0.5 percent up to 0.7 percent between 2020 and 2031, with most of the gains coming in Hobart.
And it seemed that some Melbourne residents wanting a relatively safe work-from-home retreat still wanted the option of a convenient weekly commute to meetings in the CBD. If this wasn’t needed, well, they just moved to South East Queensland.
And the big losers? Take your pick of pretty much any capital city CBD across the nation, with greater Sydney a very sad sea of red on our attached map of Covid population impacts. No wonder the NSW Government are lobbying to crank up migration numbers.
As far as the other capitals went, those most adversely impacted after Sydney were, In diminishing order, the ABS regions of Brisbane, Melbourne, Perth and then Adelaide.
By way of benchmarks, we anticipate that the annual pre-Covid national growth rate of 1.6 percent will drop to an annual average of about 1.0 percent out to 2031.
In terms of total Australian population, this translates to a predicted post-Covid figure of 28.5 million, compared to a pre-Covid figure of 30.3 million, a drop of 1.8 million persons, due to Covid impacts.
When it comes to pre-schoolers aged 0-4 years, the national predicted pre-Covid figure of 1.9 million could drop by 340,000 to 1.56 million, with the biggest losses experienced in the suburbs of Melbourne and Sydney
For school children aged 5 to 17 years, the expected national pre-Covid population could drop by more than half a million students, from 4.8 million to 4.3 million. At 25 kids per class, that’s enough kids to fill more than 20,000 classrooms that we’d expected to see by 2031, but now we don’t.
Where these gaps in previous forecasts are likely to be concentrated is fundamental to planning decisions over the next decade.
All EGS client schools will have this pre-Covid and post-Covid information for total population, pre-schoolers and school children projected as a summary onto their major catchments.
In addition, on request, EGS qualified professionals will be able to access EGS fine-grained data for school planning projects, such as a new campus, or for commercial expansion plans for a pre-Covid growth area.
Planning before Covid
Before Covid hit our shores in late 2019, population forecasts for urban planners were pretty straightforward.
After the detailed data had been published from the 2016 Census, projections were prepared for the Australian Government Department of Health by the Australian Bureau of Statistics. These projections reflected assumptions made about future fertility, mortality and migration trends.
It was all very official and credible and was produced down to relatively fine grained SA2 levels of about 10,000 persons and extensively used by schools, developers, big business and urban planners at all levels of Government and across the private sector.
The Health Department data was considered so reliable, you could take it to the bank and many investors did just that.
And then along came Covid in late 2019 and made all prior population forecasts redundant.
National borders were closed, many foreign students already here departed our shores, potential students and skilled workers were locked out, businesses were shut down for months at a time, working from home became the norm, CBDs were deserted and families began to drift outwards from Melbourne and Sydney into the regions and then interstate.
The December 2021 data from the ABS for mid-2021 showed Victoria lost so many overseas migrants and interstate migrants that the state was de-populating over the previous year. For planners counting on future population growth to underpin investments, this is genuinely scary stuff. https://www.abs.gov.au/statistics/people/population/national-state-and-territory-population/jun-2021
Queensland was the biggest winner in terms of gaining these interstate migrants from both New South Wales and Victoria, with anecdotal evidence inferring most gains were in the outlying coastal regions of South East Queensland and possibly northern NSW.
In early January 2022, we were in fact about to fine tune our forecasts to take these latest ABS figures into account, but ballooning omicron numbers by then had pretty much spoiled that sense of post-vaccination optimism.
We will monitor developments over the next months for the expected peak and fade of omicron and the possible arrival of new Covid variants. When we have more substantial evidence of sustainable trends, we will re-visit our forecasts.
We have a way to go yet with this virus, unfortunately, and with the evolving impact it is having on our total population numbers and spatial growth patterns across the nation.


